GEOTECHNICAL ENGINEERING1
ASHFORD
HomeLaboratoryAtterberg limits

Atterberg Limits Testing in Ashford: BS 5930 Soil Classification

Knowledgeable. Thorough. Resourceful.

LEARN MORE

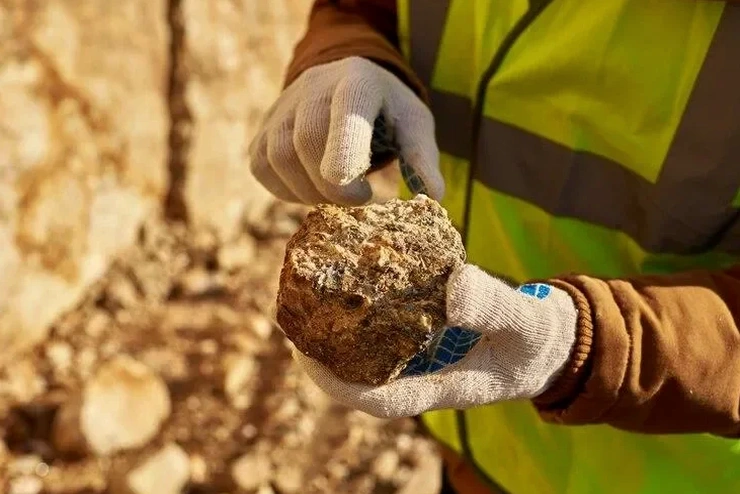
A common misstep on Ashford building sites is treating all clay as if it behaves the same way. The Weald Clay and Gault Clay that underlie much of the borough both look unremarkable at first glance, yet their Atterberg limits tell completely different stories. One might remain stable through a wet winter; the other can swell enough to crack ground-floor masonry within eighteen months. Our laboratory runs the full Atterberg limits suite — liquid limit, plastic limit, and plasticity index — under BS 5930 and BS EN 1997-2 procedures. The data feeds directly into foundation design, earthworks specification, and slope stability assessments where shrink-swell potential governs the factor of safety. For Ashford’s characteristic mixed drift deposits, combining Atterberg limits with a grain size analysis often reveals the full picture that neither test provides alone.

A plasticity index above 30% in Ashford's Weald Clay signals a shrink-swell risk that no standard strip footing should ignore.

Our service areas

Scope of work

A recent residential scheme off Simone Weil Avenue hit a layer of silty clay that the trial pit logs described simply as firm brown material. The contractor assumed standard bearing capacity and poured strip footings. Within six months, differential movement appeared at the party wall. When we ran the Atterberg limits on undisturbed samples from the same horizon, the liquid limit came back at 68% and the plasticity index at 38% — values that place the material firmly in the high-plasticity CH group. That classification changes everything: the design team switched to a suspended ground floor with deepened edge beams founded below the active zone. The Atterberg limits test itself is methodical. We dry the sample at 60°C, sieve through the 425 µm sieve, and determine the liquid limit using the Casagrande cup method with 25 blows per groove closure. The plastic limit is obtained by rolling 3 mm threads until they crumble. The difference between those two numbers — the plasticity index — is what tells you how much water the clay can absorb before its consistency shifts from semi-solid to plastic to liquid. In Ashford’s post-glacial valley deposits, that number often surprises engineers who are more familiar with London Clay further north.
Atterberg Limits Testing in Ashford: BS 5930 Soil Classification
Technical reference — Ashford

Area-specific notes

The Casagrande cup apparatus sits on a bench in our soils lab — a brass cup, a hardened rubber base, a grooving tool that cuts a precise 2 mm-wide channel through the clay paste. It looks almost old-fashioned, but the data it produces governs million-pound decisions. Ashford sits at roughly 51.1°N latitude with a temperate maritime climate that delivers consistent winter rainfall averaging 700 mm annually. That moisture cycles deep into the ground, and when it reaches a CH clay with a liquid limit above 60%, the soil can transition from a stiff, safe bearing stratum into something that deforms under modest structural loads. The risk is not theoretical. In the Park Farm and Singleton areas, where housing development continues on former agricultural land, ignoring the Atterberg limits during the site investigation phase has led to remedial underpinning costs that dwarf the original testing budget. BS 5930 classification ties the plasticity index directly to expected volume change potential, and for Ashford's geological setting, that correlation is the cheapest insurance a developer can buy.

Need a geotechnical assessment?

Reply within 24h.

Email: contact@geotechnical-engineering1.com

Standards used


BS 5930:2015+A1:2020 — Code of practice for ground investigations, BS 1377-2:2022 — Methods of test for soils: classification tests, BS EN 1997-2:2007 — Eurocode 7: Ground investigation and testing

Typical values

ParameterTypical value
Liquid limit (LL) range tested20% to 120%
Plastic limit (PL) method3 mm thread rolling, BS 1377-2
Plasticity index (PI) calculationPI = LL - PL
Liquidity index (LI) for in-situ stateLI = (w - PL) / PI
Sample preparationOven-dried at 60°C, wet-sieved 425 µm
Classification systemBS 5930 / Casagrande plasticity chart
Reporting standardBS EN 1997-2, Clause 5.4

Frequently asked questions


What do Atterberg limits testing cost for an Ashford building plot?

Atterberg limits testing for a typical set of three samples from an Ashford site investigation runs between £50 and £90 per sample, depending on the number of specimens and whether the full suite (liquid limit, plastic limit, and natural moisture content) is requested. Most residential plots need two to four samples to characterise the near-surface clay horizon adequately.

How many samples do I need for a site on Weald Clay in Ashford?

At least one sample per distinct clay horizon encountered in the borehole or trial pit log, with a minimum of three samples recommended for any Ashford site underlain by the Weald Clay formation. The material can vary significantly in plasticity over short vertical distances, and lumping horizons together risks missing a problematic high-plasticity layer that would require foundation design changes.

Is the Atterberg limits test enough to predict clay heave in Ashford?

The Atterberg limits provide the plasticity index, which is the primary input for classifying volume change potential under BS 5930. However, a complete shrink-swell assessment for Ashford sites also requires natural moisture content, particle size distribution, and sometimes suction measurements. The plasticity index alone gives a reliable first-order classification, but we recommend pairing it with a moisture content profile through the active zone depth.

Watch the video

Location and service area

We serve projects across Ashford and surrounding areas.

View larger map