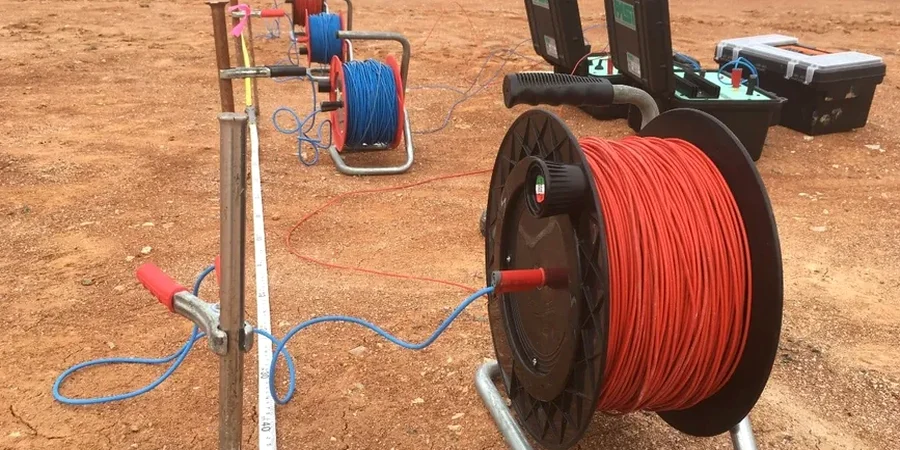
Plenty of firms drill a borehole in Ashford and walk away thinking they have the full picture, only to hit a buried channel of River Stour gravel that the point data missed. That gap between boreholes is where electrical resistivity earns its keep. Vertical Electrical Sounding maps the subsurface continuously, revealing transitions between the Wealden Clay, the Hythe Beds, and any sand lenses that could play havoc with foundation design. We run Schlumberger and Wenner arrays across sites from the Eureka Park business quarter to the rural fringes near the North Downs, delivering 2D profiles that flag low-resistivity zones tied to groundwater or high-resistivity anomalies that often mean gravel pockets. For a town growing as fast as Ashford—with 80,000 residents and major infrastructure like the M20 corridor and HS1 rail link—integrating geophysics early avoids the costly surprise of hitting running sand halfway through a piling programme. Many ground investigation specs under Eurocode 7 now expect a geophysical layer precisely because a single borehole log cannot interpolate what happens between two points ten metres apart.
A resistivity profile doesn’t guess what’s between boreholes—it measures it, giving you a continuous cross-section rather than isolated point data.